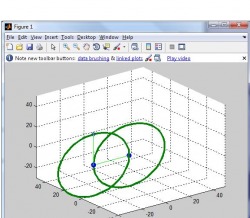
Move the arm in the circle
% två cirklar och två armar
clear, clf
R=30;
LS=30; LM=23; LT=17; % visarnas längder
fi=0:2*pi/60:2*pi;
for jj = 1:61
hh(jj) = 0
end
plot3(0,0,0,'o',R*cos(fi),hh, R*sin(fi), 'Linewidth',3)
axis([-40 50 -40 50 -30 50]), hold on, drawnow
grid
%R = [5;0;0]
%M=[cos(pi/2) -sin(pi/) 0; sin(pi/2) cos(pi/2) 0; 0 0 1]
%X = M*R
dv=2*pi/60;
sx=LS*sin(dv*10); sy=LS*cos(dv*10);
plot3(sx,0,sy,'o',[0 sx],[0 0],[0 sy],'g')
hold on
aa= sx
bb = sy
sx=LS*sin(dv*15); sy=LS*cos(dv*15);
plot3(aa+0,0,bb+0,'o',aa + R*cos(fi),hh, bb + R*sin(fi), 'Linewidth',3)
plot3(aa+sx,0,bb+sy,'o',aa + [0 sx],[0 0],bb + [0 sy],'g')
%Percy Villegas Tello
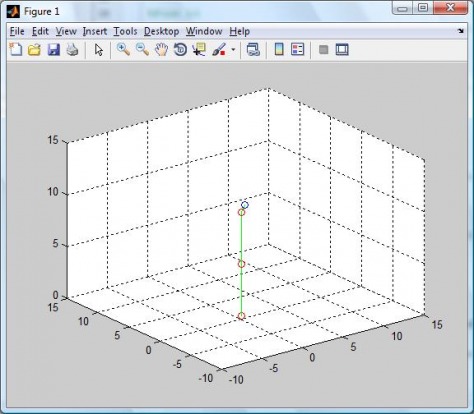
RobotArm
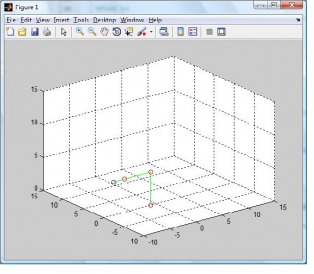
Here you can see an easy Robot arm in MATLAB
You have two program, head program there you write the angles and the print function how print the robot
%HEAD PROGRAM
%HeadCoordianteTransforms "Head"
%written the angle
RotationAngle_1 = 90;
RotationAngle_2 = 90;
RotationAngle_3 = 90;
%Angle to radian
radian_1 = RotationAngle_1 /360 * 2*pi;
radian_2 = RotationAngle_2 /360 * 2*pi;
radian_3 = RotationAngle_3 /360 * 2*pi;
% Call the function how plot the robot arm
Rotation_Zaxis(radian_1,radian_2,radian_3)
%%%%%%%%%%%%%%%%%%%%%%%%
% PRINT PROGRAM
%Rotation
%Joint 1 is rotating around its own Z-axis
%Joint 2 and 3 are rotating around their Y-axes
function [X1]= Rotation_Zaxis(angle_1,angle_2,angle_3)
hold off;
%The rotation matris for rotations around z axes
%X1 = Rz*Xw
Rz = [cos(angle_1) -sin(angle_1) 0;sin(angle_1) cos(angle_1) 0; 0 0 1];
Xw = [1; 0; 0];
X1 = Rz * Xw;
%Transformation matrices for z axes
Tz = [cos(angle_1) -sin(angle_1) 0 0;sin(angle_1) cos(angle_1) 0 0;0 0 1 5 ;0 0 0 1];
%Plot L1
plot3(X1(1),X1(2),0,'o r',[X1(1) X1(1)],[X1(2) X1(2)],[0 5],'g'),hold on, drawnow;
grid
%Transformation matrice for y axes
Ty = [cos(angle_2) 0 sin(angle_2) 5*sin(angle_2);0 1 0 0;-sin(angle_2) 0 cos(angle_2) 5*cos(angle_2) ;0 0 0 1];
%The position of L2
Pos2Frame = Tz*Ty;
%Plot L2
plot3(X1(1),X1(2),5,'o r',[X1(1) Pos2Frame(13)+X1(1)],[X1(2) Pos2Frame(14)+X1(2)],[5 ,Pos2Frame(15)],'g'),hold on, drawnow;
%Transformation matrice for y axes
Ty1 = [cos(angle_3) 0 sin(angle_3) 3*sin(angle_3);0 1 0 0;-sin(angle_3) 0 cos(angle_3) 3*cos(angle_3) ;0 0 0 1];
%The position of L3
EndPosition = Tz*Ty*Ty1
%plot L3
plot3(Pos2Frame(13)+X1(1),Pos2Frame(14)+X1(2),Pos2Frame(15),'o r',[Pos2Frame(13)+X1(1) EndPosition(13)],[Pos2Frame(14)+X1(2) EndPosition(14)],[Pos2Frame(15) EndPosition(15)],'g'),hold on, drawnow
plot3(EndPosition(13),EndPosition(14),EndPosition(15),'o')
axis([-10 15 -10 15 0 15])
grid on
%Percy Villegas Tello
How a Graphical User Interface Works in MATLAB
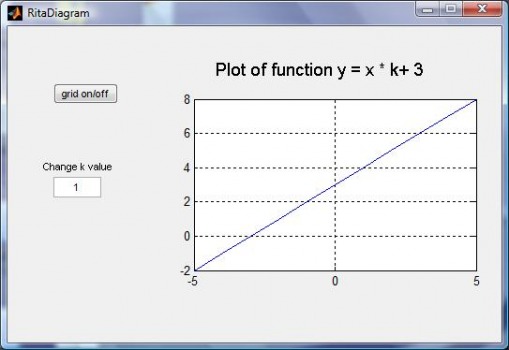
We want to change the k value in the function y = x * k +3.
Here you see MATLAB and how you must choose for creating and displaying a graphical use interface!
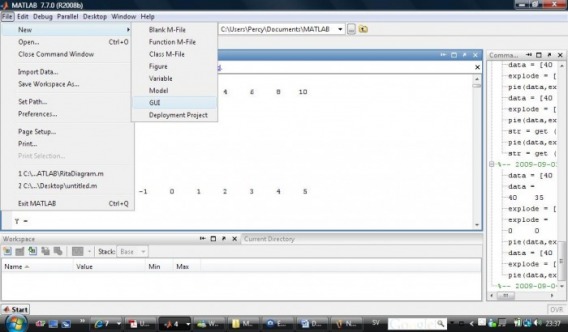
Our task is to change the k value in the function y = x * k + 3
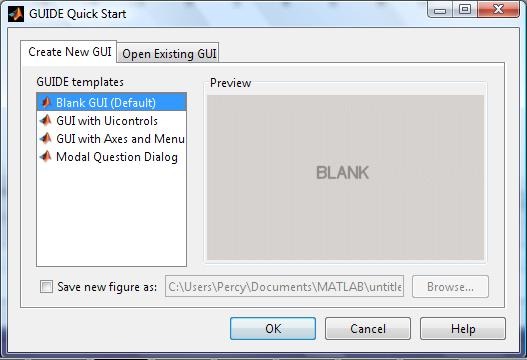
Choose Blank GUI (Default), see the picture
The completed GUI layout
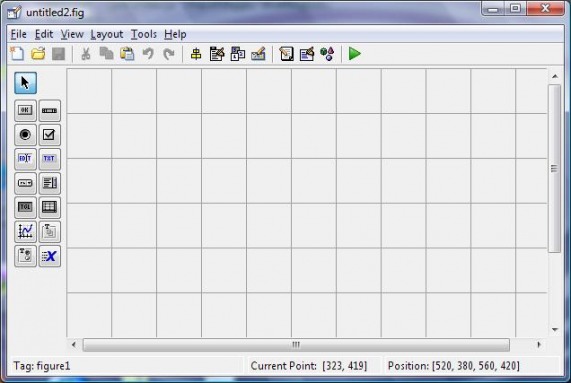
Click on the "pushbutton" button in the list of GUI components and create the shape of the pushbutton in the layout area.
Here you can see what you can do with GUI!!
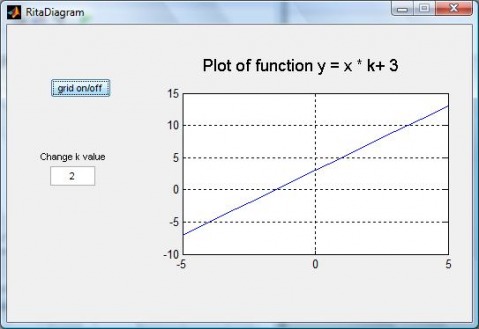
Here the code:
If you have problem send me a mail!
Percy Villegas Tello
2009-09-05
function varargout = RitaDiagram(varargin)
gui_Singleton = 1;
gui_State = struct('gui_Name', mfilename, ...
'gui_Singleton', gui_Singleton, ...
'gui_OpeningFcn', @RitaDiagram_OpeningFcn, ...
'gui_OutputFcn', @RitaDiagram_OutputFcn, ...
'gui_LayoutFcn', [] , ...
'gui_Callback', []);
if nargin && ischar(varargin{1})
gui_State.gui_Callback = str2func(varargin{1});
end
if nargout
[varargout{1:nargout}] = gui_mainfcn(gui_State, varargin{:});
else
gui_mainfcn(gui_State, varargin{:});
end
% --- Executes just before RitaDiagram is made visible.
function RitaDiagram_OpeningFcn(hObject, eventdata, handles, varargin)
handles.output = hObject;
% Update handles structure
guidata(hObject, handles);
% --- Outputs from this function are returned to the command line.
function varargout = RitaDiagram_OutputFcn(hObject, eventdata, handles)
varargout{1} = handles.output;
% --- Executes on button press in pushbutton1.
function pushbutton1_Callback(hObject, eventdata, handles)
grid on
persistent count
if isempty(count )
count =0;
end
count = count +1
if (count>1)
count = 0
grid off
end
if (count==1)
grid on
end
function edit1_Callback(hObject, eventdata, handles)
value = str2double(get (hObject,'String'))
x = -5:1:5
y = x* value + 3
plot(x,y)
grid on
% Percy Villegas Tello 2009-09-05
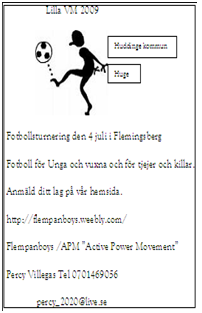
Dags att anmäla sitt lag till fotbollsturneringer "Lilla VM 2009"
Den 4 juli Klockan 10:00 i Flemingsberg "Annerstaskolan"
Mera information om turneringen Lilla VM 2009, på vår nya sida:
http://apm30.weebly.com/index.html
Våra Sponsorer
Huddinge Kommun http://www.huddinge.se/
Huge http://www.huge.se/
UngZon http://www.ungzon.se/
Vänster Partiet http://www2.vansterpartiet.se/huddinge/
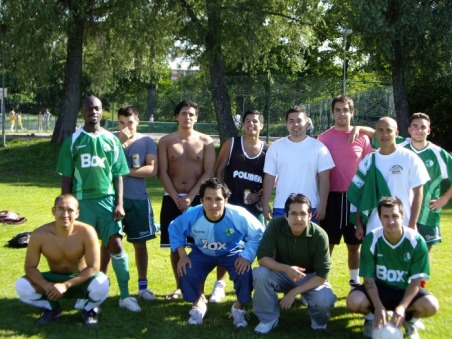
Bilder från föra året "Lilla VM 2008"
http://www.pixbox.se/alb_show_id847539_page4.html
Lilla VM 2009
Hej den 4 juli 2009 ordnar vi en fotbollsturnering "Lilla VM 2009" i Flemingsberg "Annerstaskolan". Att anmäla hela sitt lag kostar 200 kr för de som är över 16 år. De som är under 16 år betalar 150 för hela laget.
Hälsningar och välkomna till vårt Fest!!
Percy Villegas
APM "ACTIVE POWER MOVEMENT"/FlempanBoys
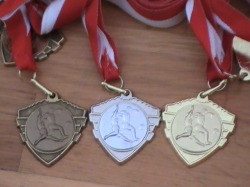
Här är medaljer Guld, Silver och Brons!!!!

lilla VM 2009
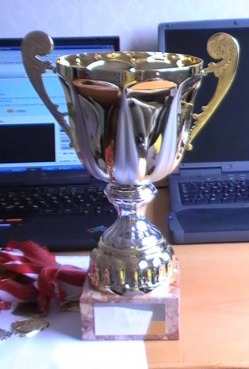
Denna pokal har graverad "Lilla VM 209". Nästa år ska det stå "Lilla VM 2010":
Kontakt person för turneringen och denna sida
Percy Villegas
0701469056
[email protected]
Kontakta oss

Kontakt person för turneringen och denna sida
Percy Villegas
0701469056
[email protected]
